
The previous post gave me some confidence to suspect that storms in the north Atlantic basin may give rise to much of the microseism activity I see on my seismograph. Earlier this winter I ran across a public US Navy web page that shows the results of computer modeling of significant wave height in the north Atlantic and have been visually comparing those plots to my microseism activity. At least on some qualitative level this new information continues to support the notion that the microseisms I see result from storms at sea. Take a look at the two examples below.
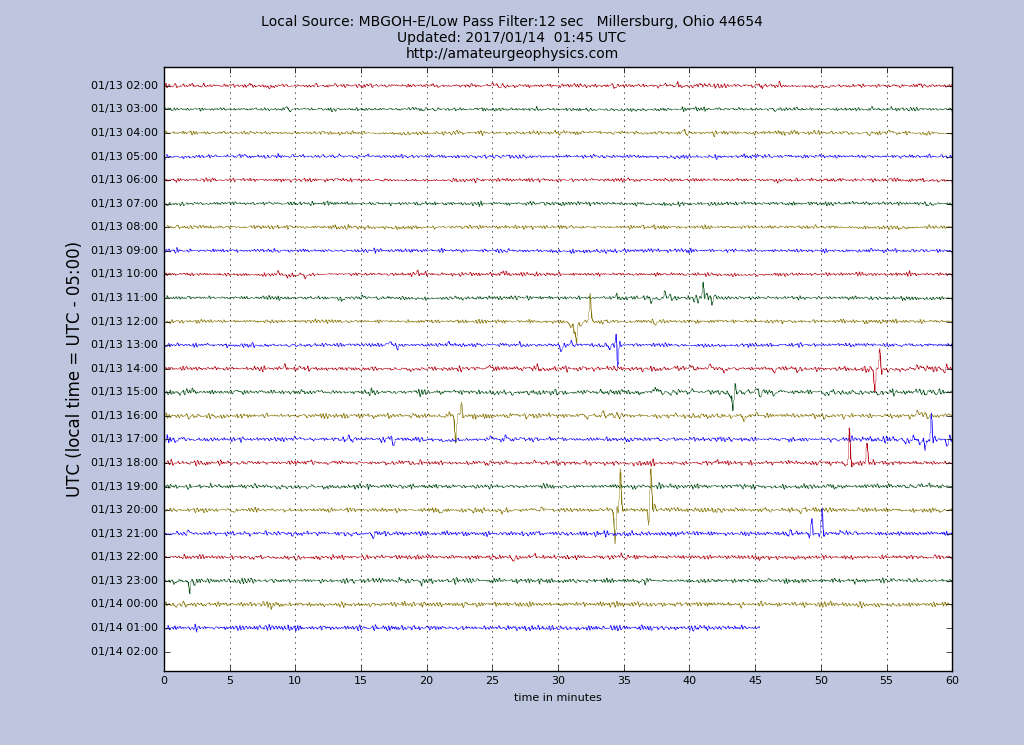
On Jan 14, 2017, the seismograph was quiet so I looked at the significant wave height model to find that it was also very quiet:

Today, Feb 14, 2017 the seismograph is very noisy:

Take a look at the Significant Wave Height now. The wave heights at the center are in the upper 30 to mid 40 feet values!

I had actually predicted that this would happen on Feb 11, 2017 by looking ahead at the Significant Wave forecast given by the model. If I can find access to the gridded data or come up with a way to at least roughly re-digitize these charts I will try to see if there is a simple relationship and correlation between the wave height, the distance from the seismograph to the center, etc. and the amplitude of the microseisms.
This suddenly makes the microseisms, which used to be more of an annoyance, now almost as interesting to watch as the earthquakes.

My deepest congratulations, Mic. The correlation is well on its way.
Thank you, Gilles. I need just a few more numbers… 🙂
If you could predict when is the next big one in New Zealand ( and where) that would be great 🙂
…and I would be famous. 😎
Definitely 🙂