Introduction
The sounds in our environment carry a great deal of information. The sense of hearing in most mammals is highly developed to allow them to extract useful information from sound and humans are no exception. We are constantly monitoring the noisy environment we live in, extracting information we need or want from it and discarding the rest.
We can also analyze sounds mathematically to extract very detailed information about the sources of sound. In the following example we will analyze the sound of a vacuum cleaner to introduce the ideas of spectrum analysis of rotating machinery.
Discussion of the theoretical model
A vacuum cleaner is a commonly available rotating machine. An upright vacuum cleaner usually has one electric motor with a main suction fan and a shaft extension which drives the agitator brush roll via a rubber drive belt. There are variations; sometimes there is a separate motor driving the brush roll. Sometimes there is a small additional fan on the main motor to provide ventilating air to keep the motor cool.
As long as the load on the motor is steady the motor will run at constant rotational speed usually specified in revolutions per minute (rpm). When working with sound it is more convenient to think about the rotational speed in revolutions per second to easily relate it to frequency in Hertz (cycles per second). The trivial conversion between the two is
If the vacuum has an attachment hose the air load on the suction fan can be reduced by sealing the end of the hose with your hand. This will result in increased the motor speed. Contrary to popular opinion, a vacuum cleaner does less work if you seal off the hose. Vacuum cleaner motors typically will operate in the 20,000 to 30,000 rpm range (333 to 500 revolutions per second) but some may operate as low as 12,000 rpm (200 rps) to as high as 40,000 rpm (667 rps). The motor generates sound at equivalent frequencies due to the forces of slight mechanical unbalance left over from the manufacturing process so we should expect to see a spectral peak due to the motor speed in our analysis.
The main suction fan is also rotating at that speed and generates a pulse of sound at its blade passing frequency, just the number of blades on the fan multiplied by the rotational speed in revolutions per second. Common suction fans may have 5, 6, or 9 blades.
Acquiring the Spectrogram
Setup Raven Lite to record from the input device you want to use and start recording to memory. Power on the vacuum cleaner and then operate it quickly through several modes: idling in the storage position, with the nozzle and brush roll on carpet, in the tool cleaning mode with no obstruction or tool on the end of the hose and then briefly with the end of the hose sealed with your hand. Then turn off the vacuum cleaner. Stop the recording when the vacuum has completely stopped and save it to disk.
Interpreting the Spectrogram
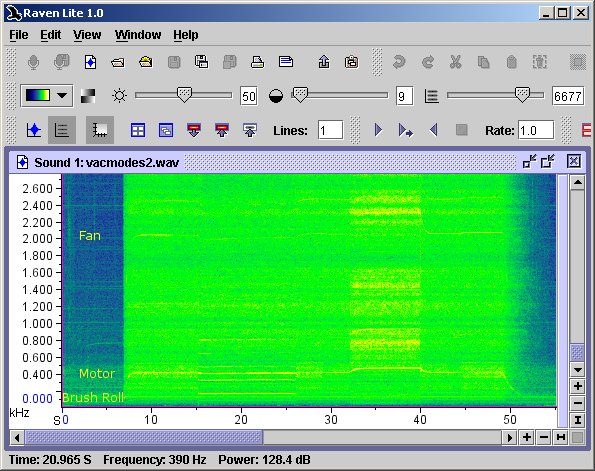
The spectrogram for the vacuum cleaner I recorded is shown:

The horizontal axis is the time axis running from left to right and the vertical axis is the frequency running from low frequencies at the bottom to higher frequencies at the top. The amplitude of the sound is denoted by the brightness of the display with the brighter colors representing higher amplitudes.
Horizontal bright bands are the features of interest. These are the tones that we hope to relate back to the rotating components in the vacuum cleaner. When the vacuum cleaner is energized (at the far left part of the green band) you can see a “knee” on the motor band as it comes up to speed. In this first operating mode, idling, the fan noise is very faint but visible. The next operating mode is with the nozzle dropped down onto the carpet. You can see the motor speed dropped just a little bit due to the load of the brush roll now brushing the carpet. In this mode you can see a yellow line due to the brush roll rotation and the motor but no fan noise. Its noise is too low to see on this vacuum cleaner in this mode. The cleaner is briefly returned to the idle mode and then the end of the hose is sealed by hand. You can see the motor speed increase. The amplitude of noise has generally increased and you can see the fan noise in this mode. Finally, at the far right portion of the green area you can see the motor speed drop off after the vacuum is switched off.
I used the mouse pointer to pick out the following frequencies.
| Component | Idling | Carpet | Hose Open | Hose Sealed |
| Motor | 402 Hz | 390 Hz | 402 Hz | 450 Hz |
| Brush | n/a | 154 Hz | n/a | n/a |
| Fan | 2035 Hz | 1999 Hz | 2046 Hz | 2295 Hz |
The motor frequency indicates that this vacuum cleaner motor rotates at speed ranging from 23,400 to 27,000 rpm. The ratio between the fan blade passing frequency and the motor rotational frequency ranges from 5.06 to 5.13 indicating that the suction fan has five blades on it.
The brush roll shows up at a frequency of 154 Hz. Because there are two rows of brushes on the brush roll the dominant frequency is twice the rotational frequency indicating that the brush roll is turning at about 77 revolutions per second or 4620 rpm. If the brush roll has more than two rows of brushes it most likely will brush continuously and not appear as a distinct frequency.
You can often see harmonics of the discrete tones described here. If you look closely you can see harmonics of the brush rotation.
Updated Notes and Images on this Project
Commenter Tim’s suggestion to increase the brightness and contrast settings to enhance the discrete frequency components resulted in doing just that. I have appended Raven images with those settings applied below and also make a couple of additional observations.
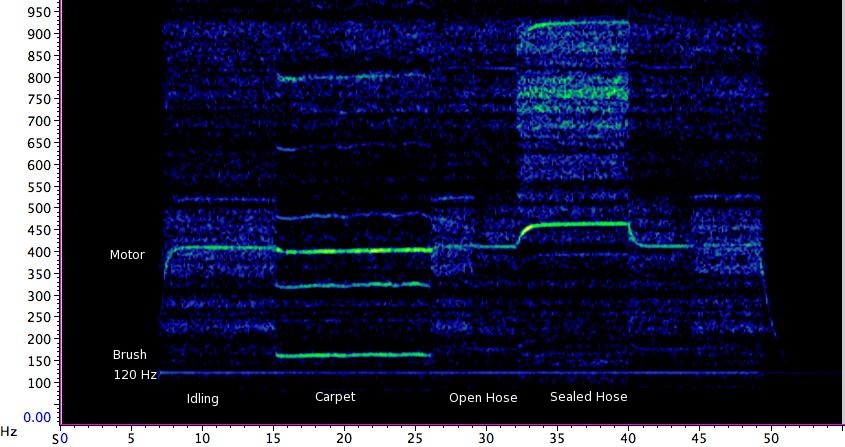
The spectrogram shown below is roughly the same view as the original spectrogram shown above but with the brightness and contrast values increased. The fan blade passing tone is much easier to see although it is somewhat concealed by broadband noise in the sealed hose condition. Another component of interest is apparent in the enhanced display, that of the 120 Hz hum, the second harmonic of the actual 60 Hz power line frequency.

I have also now included a view of the same spectrogram that is zoomed in to show the lower frequency components. This view shows the speed transitions at startup, between operating modes, and at shutdown much more clearly than before. The harmonic nature of the brush roll noise on carpet is also much easier to see in this view. Notice the regular spacing of lines above the line labelled “Brush” at intervals equal to its distance above the 0 Hz line. I picked frequencies of 158, 319, 479, 637, and 796 Hz corresponding to the first, second, third, fourth, and fifth harmonic of the “Brush” tone. Keep in mind that the line labelled “Brush” is the 2nd harmonic of the brush roll rotation frequency because the brush has two rows of bristles on it. Thus all of odd harmonics of the brush rotation are suppressed while the even harmonics of 2,4,6,8, and 10 of the rotation frequency are present. The odd harmonics would show up on this style of brush roll if it was severely out of balance.

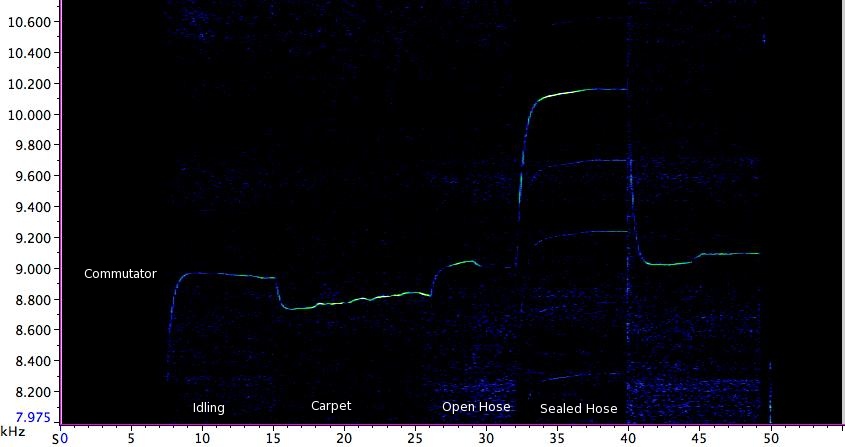
The last spectrogram shows an additional feature that I had overlooked in the original analysis. This is a dim, low amplitude but high frequency tone related to the 22 bar commutator and appearing as the 22nd harmonic of the motor rotation. Of note here is the fact that changes in motor speed are magnified by the harmonic multiplier. In other words a change of 100 Hz in the motor speed would show up as a change of 2200 Hz in the commutator tone.

The zoomed spectrograms allow for better selectivity in reading the frequency values when the number of lines chosen for the spectrogram calculation is large. A new set of values is shown below which along with the calculation of the number of fan blades and commutator bars shows the effect of the increased precision.
| Component | Idling | Carpet | Hose Open | Hose Sealed |
| Brush | 158 Hz | |||
| Motor | 406 Hz | 397 Hz | 406 Hz | 459 Hz |
| Fan | 2032 Hz | 1984 Hz | 2041 Hz | 2301 Hz |
| Commutator | 8948 Hz | 8780 Hz | 8987 Hz | 10129 Hz |
Calculated values for the number of fan blades and commutator bars using measured frequencies from the table above and dividing by the motor rotation frequency are shown in the table below.
| Component | Idling | Carpet | Hose Open | Hose Sealed |
| Fan Blades | 5.00 | 5.00 | 5.03 | 5.01 |
| Commutator Bars | 22.04 | 22.12 | 22.14 | 22.07 |

nice work, i recently did an experiment with a vacuum in a anechoic chamber finding the main frequency band being 250Hz corresponding to 15000 rpm.
Another nice example. Thanks for sharing. If you increase the brightness and contrast control values, the components of the spectrogram will be easier to see.
Tim
The discrete frequency components are actually easier to see in Raven Lite than they appear in the screen capture I show on the webpage. Although I should look at it again, I think the discrete components don’t extend very high above the wideband noise of the vacuum cleaner. I think this was about the optimum to get all of them to display at once. It looks like I have the contrast turned way down but didn’t change the brightness from the default…I need to go back and look at it. Thanks again.
Update
Yes. A few adjustments to the brightness and contrast in addition to expanding the frequency axis really makes the discrete components pop out. Page updates with additional images are on the way…
Hi Mic,
I’m writing a thesis on sound analysis of rotating machines and (since I’m an IT student) I don’t have extensive knowledge in physics nor acoustics :(. I’ve been wondering around the internet looking for info. Your post here is exactly what i needed to move on from the dead-point I’m on.
If you wouldn’t mind to give me couple of tips on the analysis.
I have a recording of the sound (link) produced by rotating machine (liquid separator) and I know that there are 2 parts that rotate (motor and bowl). From what I’ve been told the bowl rotates on higher rpm than the motor and bowl’s rps is about 75 Hz (although it might be not very accurate since it wasn’t a measurement but rather estimation of the technician working with machine). Nevertheless max bowl’s rpm are 9000 ~ 150Hz.
My problem is that I can’t see these frequencies on the spectrogram (link)
Very possible that I just don’t know where to look and I’d appreciate any input.
Anton
Hi Anton,
The frequencies that you are talking about, bowl rotating at 75 Hz up to 150 Hz, are located way down at the bottom of your spectrogram. You need to zoom down into that region and probably adjust the number of lines/brightness/contrast to enhance those spectral components as commenter Tim and I discuss in earlier comments. When you have a stationary sound such as you have in your recording you can also do a power spectrum instead of the spectrogram. You can use Matlab, Octave, SciLab, others or something like Audacity as I used below. I chose the maximum number of lines and then exported the spectrum to Excel. Then you can plot just the lower frequencies to see more detail there. Sometimes the peaks show up better if you plot the linear amplitudes rather than the levels (dB, which being logarithmic, compresses the scale).
I see a couple of peaks in the area you mention, the lower at about 64.6 Hz and another at about twice that at 126.5 Hz.
From your description indicates that the bowl speed is variable, typically 75 Hz up to a max of 150 Hz. Can you change the bowl speed while it is operating and record that sound? Then you can look at the spectrogram for frequencies that change. What can you find out about the machine? What kind of motor? What is the drive system between the motor and the bowl (belt, gears, something else? Gears should give a fixed ratio between the motor and bowl. A belt may slip some giving a different ratio under different loads. Analyzing an unknown machine requires gathering a lot of information and trying to put it together so the analysis makes sense.
Hope that helps a little.
Mic
Hi Mic,
Thanks for the info, it was very helpful. I’ve played around with the spectrograms available in the software I use and finally I could see the right frequencies! I’ve run the sound through lowpass and it let me hear just the bowl sound. It’s amazing how much info is hidden in what we call noise :).
I knew it wouldn’t be a simple task, but couldn’t imagine that I’ll need to consider so much about machines. I’m not sure which exactly machine was it in the sound file (with gears or belt) since they have different there.
The goal is to see if it’s possible to extract information about machine’s vibrations (bowl) from the sound for Preventing maintenance purposes. Could you give me some tips of which way to go? (or any related literature I should look into) I currently use logic + trial-n-error approach, but downside of is that it requires more time than I have.
Thanks again,
Anton
Hi Anton,
The analysis of rotating machinery using sound and vibration generally requires that you 1) record the best possible signal, 2) process it properly for the frequency information you need, and 3) then relate the frequency information to the machinery operation and its faults. Vibration signals are often used for preventive maintenance analysis because they usually have less “noise” than the sound signal. You have already discovered the importance of proper processing. Now to understand the machine operation and the faults that might show themselves in your analysis. I am not familiar at all with the machine you describe but presumably there would be a drive system (belts, gears, couplings, etc.) between the motor and the bowl, some bearings, etc. There will be residual unbalance in the rotating components, misalignments, loose components, etc. which can also cause noise and vibration. Each of these will generate frequencies which help to identify them in the spectrum, often at some multiple of the rotational speed or frequency. Here are a couple of references I found in a real quick search:
http://www.lindsayengineering.com/vibration-resources/vibration-calculator/
Click to access approach-to-solving-motor-vibration-prob.pdf
Click to access vibrationreferenceguide.pdf
Click to access tutorial.pdf
If you have ball bearings this might be helpful:
Click to access Understanding%20Bearing%20Vibration%20Frequencies.pdf
Good luck…
Mic
Wow, thanks again for quick reply!
I’ve looked through the links and they seem very useful, I’ll read it thoroughly later today.
From what i see now my approach to the problem should boil down to collecting a lot of data (sound + vibrations) from one machine which is working and one (same type) machine which has some kind of problem and try to identify this problem via analysis of sound frequencies.
I hope that works cause it will be too late to change strategy later on
regards,
Anton
btw: this is kind of machine we’re talking about: (link), maybe not the particular model from which I took the sound sample, but it has same layout.
You have a complex machine there with a lot going on inside! I hope something will jump out of your analysis that will help identify the problem.
Here is a collection of case histories of interesting machine problems that shows the kind of thinking that goes into solving these puzzles. Probably not of any specific help on any given problem though…
Click to access 1201baxt.pdf